Accuracy of Pressure Transmitters
According to the International Electro technical Commission (IEC), the accuracy of a pressure sensor indicates the maximum positive or negative deviation from the ideal characteristic curve obtained by testing a device under certain conditions and processes. In other words, it represents the maximum difference between the actual value and the value reported (measured) by the device. You can see our selection of pressure sensor by clicking here.
The accuracy of the pressure sensor is one of the most important factors in choosing a pressure sensor. There is no clear definition for accuracy and each manufacturer defines it with different variables influencing it.
Accuracy can be divided into several components, which are:
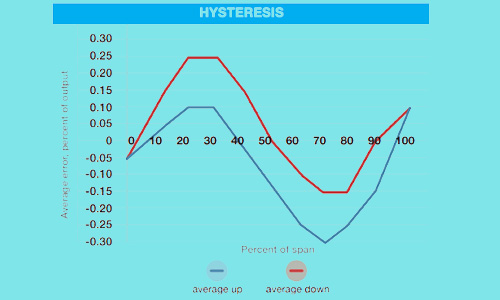
Hysteresis
It indicates the maximum difference in the amount of pressure measured at a given point in the pressure range when the pressure increases and decreases during a given cycle.
Also, it presents a fast or slow response of a pressure sensor to input changes. Hysteresis depends on the technology used in the sensor.
Linearity
It Expresses the degree of straightness of the output signal, which is usually expressed as a percentage of nonlinearity.
There are three methods, End Point, Best Fit Straight Line, and Best Fit Through Zero, to indicate non-linearity, or the degree of nonlinearity, with BFSL and End Point being the most common.
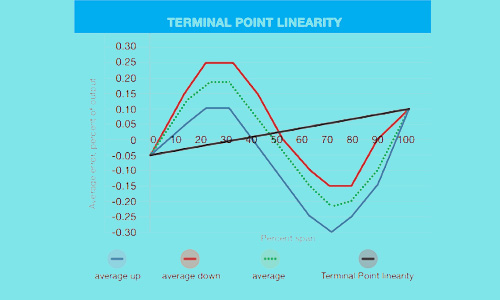
End Point
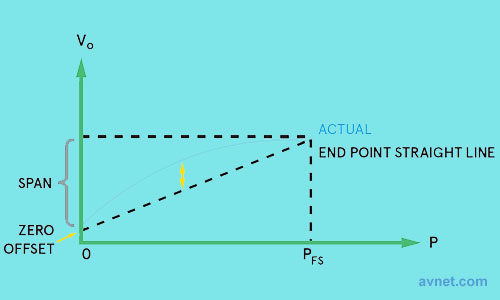
In the End Point method, a straight line (ideal) is drawn between the start point and the endpoint of the characteristic curve.
In this case, the nonlinear error is equal to the maximum characteristic deviation from the straight line (ideal) and is expressed as a percentage of FS or FSO.
BFSL (best fit straight line)
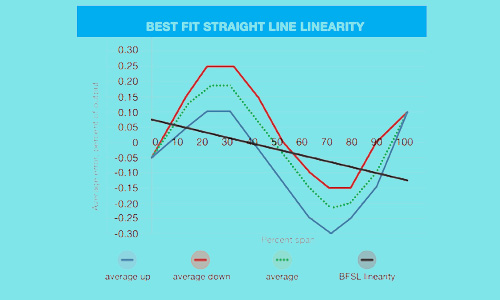
It is determined by drawing a straight line that minimizes the maximum deviation between this line and any data point on the characteristic curve.
A best fit straight line does not need to pass through the endpoints.
BSL – Best Straight Line
The best straight line is a line drawn using data for a scatter plot and represents the best relationship and approximation between those points to gain the smallest error across all the results.
Also, it is used to represent the best accuracy that can be obtained from the product.
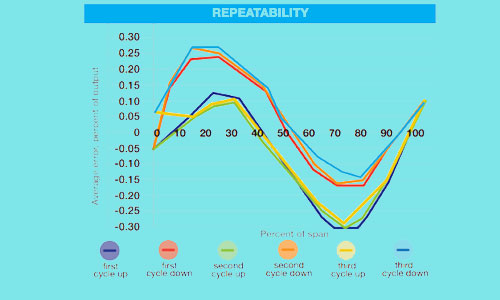
Repeatability
Repeatability indicates the amount of distance between the outputs to the same inputs, which is done consecutively and at short intervals and with the same measurement conditions, instrument, place, and method of measurement; In other words, repeatability determines how close the sensor output data will be under constant conditions and input. It is often defined as a percent of the full span (FSO).
Long Term Stability
It Indicates the amount of deviation in the amount of pressure measured by the sensor under normal conditions over a specified period of time.
Drift
It is defined as a percentage of full scale over a period of time normally a period of 12 months. Drift is the gradual destruction or change of the components which causes them to deviate from their initial calibration.
The drift causes the accuracy of the pressure sensor or transducer to decrease over time, and the sensor provides unreliable readings and measurements.
Precision
The precision of a measuring instrument is the degree to which the measured values are close to the true value. In other words, it describes the difference between the measured value and the actual value.
Difference Between Accuracy & Precision
Accuracy is defined as the degree of closeness to a true value. In other words, it shows in the worst case, how close a set of measurements is to the actual value.
Precision is the degree to which an instrument or process will repeat the same value. In other words, it is the degree of proximity of a set of measurements to each other.
Therefore, accuracy is the degree of veracity and can be determined by one measurement, while precision is the degree of reproducibility and many measurements are required to assess precision.
Span
It is the difference between the lowest value point and the highest value point of a measurement device.
FS – Full Scale / Full Span
The difference between the highest and lowest possible measurement point. It is a common term used to describe errors as a percentage instead of measurement units and overpressure ratings for devices with many different pressure ranges.
FSO – Full-Scale Output / Full Span Output
The difference between the the minimum and maximum electrical output signals of the specified operating pressure range.
Also, it can be defined as the output signal or the reading displayed produced when applying maximum measurement for a given device.
Example
Gems sensors 3100 Series Pressure Transducers specify their accuracy to be 0.25% FS (Full Scale) or less.
Full Scale is the value from when there is no pressure on the sensor to what its maximum measuring range is, not the measured pressure.
For example:
For a sensor with a 0 to 100 psi measuring range, Full Scale is 100 psi.
If you are measuring 100 psi exactly, the output should read 100 psi +/- 0.25% of 100 psi or 100 psi +/- 0.25 psi.
Still using the 0 to 100 psi measuring range but you are only measuring 10 psi, the accuracy of the output should be 10 psi +/- 0.25% of 100 psi (Full Scale) or 10 psi +/- 0.25 psi.
Temperature Error
Temperature is one of the most important factors in the correctness of pressure sensors and has a great influence on the accuracy performance of a pressure sensor.
The temperature error arises from the deviation of the measurement due to variation in the device or the ambient temperature.
It is usually expressed as a maximum error value of all possible measurements and determined on a maximum and minimum temperature named the compensated temperature range and does not necessarily express the range of operating temperatures that are often wider than the compensated temperature range for the pressure sensor.
By use of circuitry design and algorithms temperature errors within this temperature range are decreased. Outside the compensated temperature range, the maximum error is not defined outside of the compensated temperature range but the pressure sensor still operates.
Threshold temperature ranges are determined in the technical datasheet. Pressure sensors may not operate beyond the threshold temperature because it leads to mechanical and electrical damage.
Temperature error is usually expressed as a percentage of full span (% FS) over the entire compensated temperature range or as a percentage of full span (% FS) per degree Celsius, Kelvin, or Fahrenheit.
Zero Offset
Zero Offset is defined as the amount of variation in output from the ideal value at the lowest point of the measurement range.
It is expressed as a percentage of full span or in measurement or signal units such as millivolts or milliamps. Typically there are separate items for indicating zero offsets on a pressure sensor.
Referred Temperature Error
Referred Temperature Error or RTE is expressed as the maximum deviation in the positive or the negative direction from measurements taken at a defined temperature, which is typically room temperature. It is as a percentage of the full scale.
Temperature Compensation
Temperature Compensation is a correction applied to a measurement instrument to reduce errors attributed to temperature changes in a process media which is being measured or in the surrounding environment that the instrument is being used.
Please refer to other pressure sensor articles for more information:
Pressure [Explanation, Pressure Units, Types of Pressure (Static, Dynamic, Stagnation)]
Top 12 Popular Pressure Sensor Brands and Their Best Seller Products in UAE
An Eye-Opening Guide To Pressure sensor Types: Everything You Need To Know
Recent Posts
-
Booster Pump Troubleshooting and Maintenance: How to Fix and Prevent Common Issues
1. Introduction Imagine turning on your faucet only to be greeted with a weak trickle of water when …22nd Apr 2025 -
Energy-Efficient Booster Pumps: Selection and Tips for Maximizing Performance
1. Introduction Imagine never having to deal with fluctuating water pressure, noisy pumps, or skyroc …19th Apr 2025 -
Booster Pumps for Sustainable Water Systems: Irrigation and Rainwater Harvesting Solutions
1. Introduction Water scarcity is no longer a distant threat—it’s a reality affecting millions …16th Apr 2025

