null
The Fine Line of Accuracy: Demystifying Pressure Sensor Error Specifications

The Fine Line of Accuracy: Demystifying Pressure Sensor Error Specifications

Understanding accuracy and error specifications is crucial when working with sensors. These specifications determine how reliably a sensor measures and reports values, influencing its suitability for specific tasks. Accuracy represents how close a sensor's measurements are to the actual values being measured. Error specifications outline the permissible deviation from these true values.

Various factors impact accuracy, including calibration, environmental conditions, hysteresis, and manufacturing variations. Calibration ensures a sensor's readings align with true values, while environmental factors like temperature and humidity can affect performance.

Evaluating accuracy involves multiple methods such as comparison with reference standards, analyzing linearity, hysteresis, and repeatability. This assessment ensures a comprehensive understanding of a sensor's performance characteristics.

Precision, distinct from accuracy, focuses on a sensor's ability to produce consistent measurements. Understanding these specifications aids in selecting sensors best suited for specific applications, ensuring reliable and precise measurements.

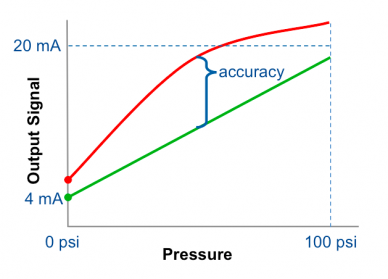
Fig 1. Pressure sensor accuracy

What is pressure sensor accuracy?

Pressure sensor accuracy refers to how closely the output of a pressure sensor matches the actual pressure being measured. It's a measure of how reliable and precise the sensor is in determining the correct pressure.

Accuracy is typically represented as a percentage of full-scale output (%FSO) or in absolute terms such as in psi (pounds per square inch) or kPa (kilopascals). For instance, a pressure sensor with an accuracy of ±1% FSO means that the sensor's reading can deviate by up to 1% from the actual pressure being measured across the full range of the sensor.

Factors affecting pressure sensor accuracy include:

  • Sensor calibration: Proper calibration ensures accuracy. Regular recalibration may be necessary to maintain accuracy over time.
  • Environmental conditions: Temperature, humidity, and other environmental factors can impact sensor accuracy. Some sensors have compensation mechanisms to minimize these effects.
  • Manufacturing quality: The precision of sensor components and assembly techniques influences accuracy.
  • Range and sensitivity: Sensors might have different accuracy specifications at different points within their measuring range.
  • When selecting a pressure sensor, it's crucial to consider the required accuracy for the intended application to ensure the sensor meets those specifications.

    How can measure the pressure sensor accuracy?

    Measuring the accuracy of a pressure sensor involves comparing its output readings to a known reference standard or a more accurate sensor in controlled conditions. Here are steps to measure pressure sensor accuracy:

  • Select a Reference Standard: Use a highly accurate pressure standard or sensor as a reference. This could be a certified pressure gauge or a sensor with a higher accuracy level.
  • Setup and Calibration: Ensure both the pressure sensor being tested and the reference standard are properly calibrated. Calibration involves adjusting the sensor to minimize any systematic errors.
  • Controlled Pressure Application: Apply known pressures within the range of the sensor being tested. Use a pressure source that is traceable to a recognized standard.
  • Record Readings: Take multiple readings from the sensor under test and the reference standard at each pressure point. Ensure stability and consistency in pressure application and recording.
  • Calculate Deviation: Compare the readings from the sensor being tested with the readings from the reference standard. Calculate the difference or deviation between the two readings to determine the sensor's accuracy.
  • Calculate Accuracy Metrics: Use statistical analysis to calculate accuracy metrics such as mean deviation, maximum deviation, and standard deviation.
  • Repeat and Validate: Perform these measurements across the sensor's operating range and multiple points to validate its accuracy across different pressure values.
  • Consider Environmental Factors: Repeat the process in varying environmental conditions if environmental factors might affect sensor accuracy. Temperature, humidity, and other factors can influence sensor performance.
  • Document Results: Record and document all measurements, deviations, and calculations. This data will serve as a reference for the sensor's accuracy.
  • Re-calibration if Necessary: If the measured accuracy deviates significantly from the specified accuracy, consider recalibration or maintenance of the sensor.
  • This process requires precision and attention to detail. Specialized equipment and expertise are often necessary to measure pressure sensor accuracy. Manufacturers may provide specific guidelines or recommend certified calibration services for accurate assessment.

    Fig 2. Accuracy formula

    What are the different methods of pressure sensor accuracy?

    Pressure sensor accuracy can be assessed through various methods, each offering insights into different aspects of the sensor's performance. Here are some common methods used to evaluate pressure sensor accuracy:

  • Comparison Method: This involves comparing the sensor's output with a known reference standard or a more accurate sensor. It's one of the most direct ways to determine accuracy by measuring the deviation between the sensor being tested and a reliable reference.
  • Calibration Certificates: Manufacturers often provide calibration certificates with detailed information about the sensor's accuracy. These certificates specify the sensor's performance at different pressure points and can be used as a reference for accuracy assessment.
  • Static Accuracy Test: Applying a known, stable pressure to the sensor and observing its output over time. This method evaluates how well the sensor maintains accuracy under constant pressure conditions.
  • Dynamic Accuracy Test: Involves subjecting the sensor to varying pressures within its operating range to assess its accuracy in dynamic conditions. This test evaluates how accurately the sensor responds to changing pressure inputs.
  • Hysteresis Test: Measures the difference in sensor output for the same pressure value, depending on whether the pressure is increasing or decreasing. Hysteresis can affect accuracy, and this test helps assess its impact.
  • Repeatability Test: This involves applying the same pressure multiple times and observing the sensor's output. Repeatability assesses the sensor's ability to produce consistent results under the same conditions.
  • Linearity Test: Evaluates how well the sensor's output follows a linear relationship with changes in pressure across its operating range. It checks if the sensor's response matches the ideal linear response.
  • Temperature and Environmental Testing: Assessing how the sensor's accuracy is affected by changes in temperature, humidity, or other environmental conditions. Some sensors may have specified accuracy within certain environmental ranges.
  • Certification and Standards Compliance: Some industries require pressure sensors to meet specific standards and certifications (e.g., ISO, ASTM, NIST). Compliance with these standards often indicates the sensor's accuracy and reliability.
  • Combining multiple testing methods provides a comprehensive evaluation of a pressure sensor's accuracy, ensuring a better understanding of its performance characteristics in various conditions. Manufacturers, calibration facilities, or specialized testing laboratories often employ these methods to verify and certify pressure sensor accuracy.

    What are the error specifications for pressure sensors?

    Error specifications for pressure sensors refer to the allowable deviations or inaccuracies in the sensor's output readings compared to the actual pressure being measured. These specifications outline the acceptable limits within which the sensor's readings are considered accurate and reliable.

    Pressure sensor error specifications typically include different types of errors:

  • Accuracy: This represents the overall correctness of the sensor's measurements. Accuracy specifications define the maximum permissible deviation between the sensor's output and the true pressure. It's often expressed as a percentage of the full-scale output (%FSO) or in absolute pressure units (e.g., psi, bar, kPa).
  • Linearity Error: Linearity error specifies the deviation from an ideal linear relationship between the applied pressure and the sensor's output. It quantifies how well the sensor's readings follow a straight line within its operating range.
  • Hysteresis Error: Hysteresis error refers to the difference in sensor output for the same pressure value, depending on whether the pressure is increasing or decreasing. It accounts for the sensor's memory effect when subjected to varying pressures.
  • Repeatability: Repeatability error measures the variation in the sensor's output readings when the same pressure is applied multiple times under identical conditions. It quantifies the sensor's consistency in producing the same output for repeated measurements.
  • Temperature and Environmental Effects: Some error specifications account for how the sensor's accuracy is influenced by temperature changes, humidity, or other environmental factors.
  • These error specifications are crucial for understanding the limitations and capabilities of a pressure sensor. They guide users in selecting sensors appropriate for specific applications, ensuring that the measurements meet the required accuracy standards. Manufacturers provide these specifications in datasheets to help customers make informed decisions about sensor suitability for their intended purposes.

    Hysteresis

    The hysteresis in pressure sensors refers to the phenomenon where the sensor's output value for a particular pressure varies depending on whether the pressure is increasing or decreasing. Essentially, the sensor cannot return to the same output value for a given pressure when pressure is cycled up and then down again. When the pressure is gradually increased and then decreased along the same path, the output of the sensor might follow a different curve, resulting in a discrepancy between the ascending and descending pressure values.

    This effect occurs due to the mechanical or material properties within the sensor. Elements like the elastic behavior of the sensing material or friction in the sensor's mechanical components can cause this deviation. Hysteresis can impact the accuracy of pressure measurements, particularly in applications where precise pressure control or consistency in readings is crucial. To mitigate its effects, calibration techniques or compensation algorithms are often employed to minimize the discrepancy and enhance the sensor's accuracy by accounting for this non-linear behavior. Understanding a sensor's hysteresis allows users to consider this characteristic in their applications and make appropriate adjustments to ensure accurate pressure readings.
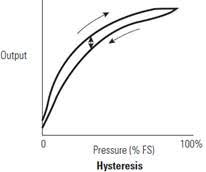
    Fig 3. Hysteresis

    Pressure sensor linearity and accuracy

    Pressure sensor linearity and accuracy are critical aspects of its performance. Linearity refers to how well the sensor's output correlates with changes in pressure across its operating range. A perfectly linear sensor would produce output values that precisely follow a straight line when plotted against pressure. However, real-world sensors may exhibit slight deviations from linearity due to inherent limitations in materials, design, or manufacturing processes. Linearity errors manifest as deviations from the ideal linear relationship between pressure input and sensor output.

    Accuracy, on the other hand, encompasses the overall correctness of the sensor's measurements compared to the true or expected pressure values. It considers various factors such as systematic errors, calibration precision, and environmental influences. Accuracy reflects how closely the sensor's readings match the actual pressure being measured. While linearity focuses on the consistency of the sensor's response across its range, accuracy evaluates the sensor's performance in providing correct measurements relative to the true pressure values, considering both linearity errors and other potential sources of inaccuracies.

    In practice, achieving high accuracy involves minimizing both linearity errors and other sources of deviation, such as calibration inaccuracies, hysteresis, temperature variations, and environmental factors. Manufacturers often specify accuracy as a percentage of full-scale output (%FSO), indicating the maximum deviation between the sensor's output and the actual pressure. Maintaining linearity within acceptable limits while ensuring high accuracy is crucial, especially in applications where precise pressure readings are essential for safety, control systems, or critical measurements.

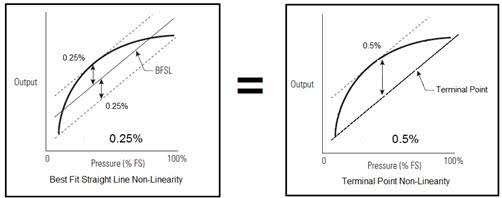
    Fig 4. Non-linearity and terminal point

    How can measure pressure sensor accuracy with End Point Methods?

    Endpoint methods are a class of techniques used to evaluate pressure sensor accuracy by focusing on the sensor's output at specific pressure points within its operating range. These methods involve comparing the sensor's output at the lower and upper ends of the pressure range with a reference standard or a known value. Here's how you can measure pressure sensor accuracy using end-point methods:

  • Select End Points: Identify the lower and upper ends of the pressure range that the sensor is designed to measure. These points should represent the minimum and maximum pressures the sensor is expected to encounter during its operation.
  • Apply Known Pressures: Apply a known and stable pressure at each endpoint. Use a reliable reference standard or a calibrated pressure source traceable to a recognized standard.
  • Record Readings: Take multiple readings from the pressure sensor at the lower and upper-pressure points. Ensure stability and consistency in pressure application and recording.
  • Compare with Reference Values: Compare the sensor's output readings at these endpoints with the known reference values. Calculate the deviation between the sensor's output and the actual applied pressure at both ends of the range.
  • Calculate Accuracy Metrics: Determine the accuracy of the sensor at each endpoint by calculating the percentage deviation or error between the sensor's output and the known reference pressure values. This deviation represents the sensor's accuracy at these specific pressure points.
  • Consider Calibration and Repeatability: Account for calibration errors and repeatability of measurements. Calibration inaccuracies and variations in sensor performance can affect accuracy measurements.
  • Document Results: Record and document all measurements, deviations, and calculations. This data will serve as a reference for the sensor's accuracy at the endpoints of its range.
  • Using end-point methods provides insight into the sensor's accuracy at specific pressure values critical to its intended application. However, it's essential to consider that the accuracy at these endpoints might not represent the sensor's performance across its entire operating range. Therefore, combining end-point measurements with other evaluation methods helps provide a more comprehensive assessment of the sensor's accuracy.

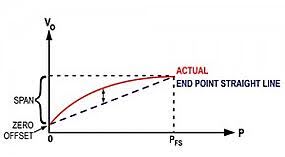
    Fig 5. Endpoint method

    BFSL Method to measure pressure sensor accuracy

    BFSL stands for "Best Fit Straight Line," a method used to determine the accuracy of pressure sensors by assessing their linearity within a specified pressure range. The goal of the BFSL method is to evaluate how well the sensor's output aligns with a straight line when plotted against the actual applied pressures within its operating range.

    Here are the steps involved in using the BFSL method to measure pressure sensor accuracy:

  • Select Pressure Points: Identify multiple pressure points within the sensor's operating range. These points should cover the minimum and maximum pressures the sensor is designed to measure and should be evenly distributed across the range.
  • Apply Known Pressures: Apply known and stable pressures at each of the selected pressure points. Use a reliable reference standard or a calibrated pressure source traceable to a recognized standard.
  • Record Readings: Take multiple readings from the pressure sensor at each selected pressure point. Record the sensor's output values corresponding to the applied pressures.
  • Plot Data Points: Plot the recorded sensor output values against the known applied pressures on a graph.
  • Fit a Straight Line: Use statistical methods or regression analysis to fit a straight line (best-fit line) through the plotted data points. This line represents the ideal linear relationship between the applied pressures and the sensor's output.
  • Calculate Deviation: Determine the deviation or error of each data point from the best-fit straight line. This deviation represents the sensor's linearity error at each pressure point.
  • Evaluate Linearity: Assess how closely the sensor's output aligns with the best-fit straight line. A sensor with higher linearity will have data points that closely follow the straight line, indicating better linearity performance.
  • Calculate Accuracy Metrics: Calculate metrics such as linearity error or percentage deviation from the best-fit line to quantify the sensor's linearity and overall accuracy within the specified pressure range.
  • The BFSL method allows engineers and technicians to evaluate the linearity of a pressure sensor across its operating range and assess its deviation from an ideal linear response. It provides insights into how well the sensor's output matches the expected linear relationship with applied pressures, contributing to a comprehensive understanding of the sensor's accuracy characteristics.

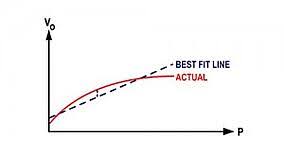
    Fig 6. Best Fit Straight Line (BFSL) method

    What does BSL stand for?

    BSL commonly stands for "Best Straight Line," a method used to assess the linearity of pressure sensors or transducers. This method involves evaluating how closely the sensor's output matches a straight line when plotted against the actual applied pressures within its operating range.

    The working principle of the BSL method involves:

  • Selecting Pressure Points: Identifying specific pressure points across the sensor's operating range. These points represent various pressure values, typically covering the minimum and maximum pressures the sensor is designed to measure.
  • Applying Known Pressures: Applying precise and stable pressures at each selected pressure point. Using a reliable reference standard or a calibrated pressure source ensures accurate applied pressures.
  • Recording Sensor Output: Taking multiple readings from the pressure sensor at each pressure point. This involves recording the sensor's output values corresponding to the applied pressures.
  • Plotting Data: Plotting the recorded sensor output values against the known applied pressures on a graph. The x-axis represents the applied pressures, while the y-axis represents the sensor's output readings.
  • Fitting a Straight Line: Using mathematical techniques like linear regression, fitting a straight line (best-fit line) through the plotted data points. This line represents the ideal linear relationship between the applied pressures and the sensor's output.
  • Assessing Linearity: Evaluating how well the sensor's output aligns with the best-fit straight line. A sensor with excellent linearity will have data points that closely adhere to the straight line, indicating a more linear response to pressure changes.
  • Calculating Deviation: Calculating the deviation or error of each data point from the best-fit straight line. This deviation represents the sensor's linearity error at each pressure point.
  • Determining Accuracy Metrics: Metrics such as linearity error or percentage deviation from the best-fit line are calculated to quantify the sensor's linearity and overall accuracy within the specified pressure range.
  • The BSL method allows for a comprehensive evaluation of a pressure sensor's linearity by examining its output behavior across different pressure points. It helps engineers and technicians understand how well the sensor's readings conform to an ideal linear response, providing valuable insights into its accuracy and performance characteristics.

    The repeatability of the pressure sensor

    Repeatability, in the context of pressure sensors, refers to the sensor's ability to produce consistent and near-identical output readings when exposed to the same or similar pressure conditions under unchanged environmental and operational circumstances. It assesses the sensor's reliability in reproducing consistent results when subjected to repeated measurements at a specific pressure point or within a defined pressure range. A highly repeatable sensor will yield nearly the same output readings when the same pressure is applied multiple times, highlighting its stability and consistency in measurement.

    To evaluate repeatability, engineers conduct multiple trials where they apply the same pressure to the sensor repeatedly, ensuring that external factors such as temperature, humidity, and other environmental conditions remain constant. By comparing the output readings obtained from each trial, the degree of variation or deviation among the readings is analyzed. Lower variation indicates higher repeatability, signifying that the sensor can consistently reproduce its output readings, which is crucial for applications requiring precision and reliability in pressure measurements, especially in critical or controlled environments.

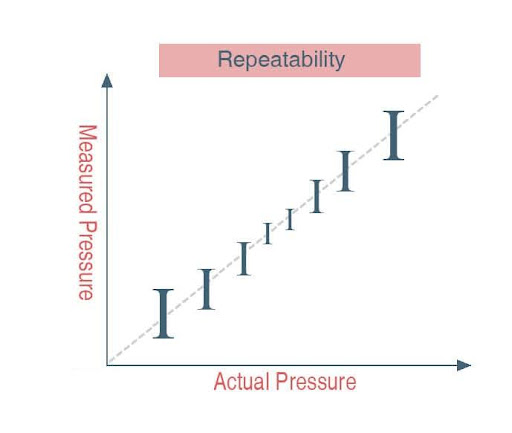
    Fig 7. Repeatability

    Long-Term Stability

    It Indicates the amount of deviation in the amount of pressure measured by the sensor under normal conditions over a specified period.

    Drift

    It is defined as a percentage of full scale over a while normally 12 months. Drift is the gradual destruction or change of the components which causes them to deviate from their initial calibration.

    The drift causes the accuracy of the pressure sensor or transducer to decrease over time, and the sensor provides unreliable readings and measurements.

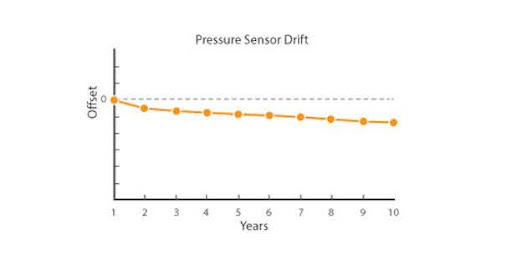
    Fig 8. Pressure sensor drift

    Which method of measuring pressure sensor accuracy is the most accurate?

    There isn't a singular "most accurate" method for measuring pressure sensor accuracy, as different methods offer unique insights into different aspects of sensor performance. The most suitable method often depends on the specific requirements of the application and the characteristics being evaluated.

    Several methods are commonly used:

  • Comparison with Reference Standards: Comparing the sensor's output directly with a highly accurate reference standard or a more precise sensor can offer a direct assessment of accuracy but might not reveal details about linearity or other characteristics.
  • End Point Methods: These focus on specific pressure points within the sensor's range and can provide targeted accuracy assessments at those points. However, they might not represent the sensor's performance across the entire range.
  • BFSL (Best Fit Straight Line) and BSL (Best Straight Line): These methods evaluate linearity across the sensor's operating range and assess how well the sensor's output aligns with a straight line. They focus on the sensor's linearity but might not account for other sources of inaccuracy.
  • Hysteresis, Repeatability, and Environmental Testing: These methods assess specific characteristics such as hysteresis effects, repeatability, and the sensor's performance in varying environmental conditions, providing insights into different aspects of sensor behavior.
  • The choice of method often involves a trade-off between comprehensiveness and specificity. Combining multiple methods can provide a more holistic view of a pressure sensor's accuracy and performance, allowing for a thorough assessment across different parameters. Manufacturers and industries often use a combination of methods to ensure a comprehensive evaluation of sensor accuracy tailored to their specific needs.

    Interpreting accuracy specifications for different pressure ranges

    Interpreting accuracy specifications for pressure sensors across different pressure ranges involves understanding how the sensor's accuracy might vary based on the applied pressure within its operating limits. Manufacturers often provide accuracy specifications at different points or ranges within the sensor's full-scale range.

    For instance:

  • Full-Scale Accuracy (%FSO): Manufacturers might specify accuracy as a percentage of full-scale output (%FSO). This indicates the maximum allowable deviation between the sensor's output and the actual pressure across the entire operating range. For example, a ±1% FSO accuracy means that the sensor's output can deviate by up to 1% of the full-scale range, regardless of the applied pressure within that range.
  • Accuracy at Specific Pressure Points: Manufacturers might offer accuracy specifications at certain pressure points or ranges within the sensor's full-scale range. For example, a sensor might have different accuracy specifications at 0-50 psi and 50-100 psi ranges.
  • Interpreting accuracy specifications involves considering how these accuracy limits apply to the specific pressures at which the sensor will be used. It's essential to ensure that the required accuracy aligns with the application's needs. If precise measurements are crucial across the entire range, a sensor with consistent accuracy throughout its full-scale range might be necessary. Conversely, if accuracy is critical only within a specific pressure range, accuracy specifications for that range should be scrutinized more closely.

    Additionally, understanding whether accuracy specifications are absolute or include factors such as linearity, hysteresis, or repeatability can provide a clearer picture of the sensor's performance under various pressure conditions. Comparing accuracy specifications from different manufacturers or models can aid in selecting the most suitable sensor for a particular application based on its accuracy requirements across different pressure ranges.

    Example

    Gems sensors 3100 Series Pressure Transducers specify their accuracy to be 0.25% FS (Full Scale) or less.

    Full Scale is the value from when there is no pressure on the sensor to what its maximum measuring range is, not the measured pressure.

    For example:

    For a sensor with a 0 to 100 psi measuring range, the Full Scale is 100 psi.

    If you are measuring 100 psi exactly, the output should read 100 psi +/- 0.25% of 100 psi or 100 psi +/- 0.25 psi.

    Still using the 0 to 100 psi measuring range but you are only measuring 10 psi, the accuracy of the output should be 10 psi +/- 0.25% of 100 psi (Full Scale) or 10 psi +/- 0.25 psi.

    Zero Offset

    Zero Offset is defined as the amount of variation in output from the ideal value at the lowest point of the measurement range.

    It is expressed as a percentage of the full span or in measurement or signal units such as millivolts or milliamps. Typically there are separate items for indicating zero offsets on a pressure sensor.
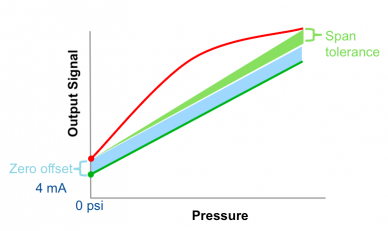
    Fig 9. Zero offset


    What are the factors that affect accuracy?

    Several factors can affect the accuracy of pressure sensors, influencing their ability to provide precise and reliable pressure measurements:

  • Calibration: Proper calibration is essential for maintaining accuracy. Over time, sensors might drift from their calibrated state due to wear, environmental factors, or electronic variations. Regular recalibration is crucial to ensuring accuracy.
  • Environmental Conditions: Temperature, humidity, and altitude variations can impact sensor accuracy. Some sensors have compensation mechanisms to account for these environmental factors, but extreme conditions might still affect accuracy.
  • Mechanical Stress: Mechanical stress or strain on the sensor, caused by factors like vibration, shock, or physical impact, can alter its performance and accuracy.
  • Hysteresis: Hysteresis occurs when a sensor's output differs depending on whether the pressure is increasing or decreasing. This non-linear behavior can affect accuracy, particularly in dynamic pressure changes.
  • Non-Linearity: Deviation from an ideal linear relationship between applied pressure and sensor output can lead to inaccuracies. Sensors might exhibit non-linear behavior within their operating range.
  • Manufacturing Variations: Variations in sensor components or manufacturing processes can affect accuracy. Differences in materials, assembly, or quality control can impact sensor performance.
  • Electronic Noise: Electronic interference or noise within the sensor or its associated electronics can introduce errors in the output readings, affecting accuracy.
  • Aging and Wear: Over time, sensor components might degrade or experience wear, impacting their performance and accuracy. This gradual degradation can affect long-term accuracy if not accounted for through recalibration or maintenance.
  • Understanding these factors allows for better consideration and mitigation of potential sources of error, ensuring that pressure sensors maintain their specified accuracy levels in various conditions and applications. Manufacturers often design sensors with these factors in mind, incorporating compensation mechanisms or calibration methods to enhance accuracy and reliability.

    Referred Temperature Error

    Referred Temperature Error or RTE is expressed as the maximum deviation in the positive or negative direction from measurements taken at a defined temperature, which is typically room temperature. It is as a percentage of the full scale.

    Temperature Compensation

    Temperature Compensation is a correction applied to a measurement instrument to reduce errors attributed to temperature changes in a process media that is being measured or in the surrounding environment in which the instrument is being used.

    Temperature Error

    Temperature is one of the most important factors in the correctness of pressure sensors and has a great influence on the accuracy performance of a pressure sensor.

    The temperature error arises from the deviation of the measurement due to variations in the device or the ambient temperature.

    It is usually expressed as a maximum error value of all possible measurements and determined on a maximum and minimum temperature named the compensated temperature range and does not necessarily express the range of operating temperatures that are often wider than the compensated temperature range for the pressure sensor.

    By use of circuitry design and algorithms temperature errors within this temperature range are decreased. Outside the compensated temperature range, the maximum error is not defined outside of the compensated temperature range but the pressure sensor still operates.

    Threshold temperature ranges are determined in the technical datasheet. Pressure sensors may not operate beyond the threshold temperature because it leads to mechanical and electrical damage.

    Temperature error is usually expressed as a percentage of full span (% FS) over the entire compensated temperature range or as a percentage of full span (% FS) per degree Celsius, Kelvin, or Fahrenheit.

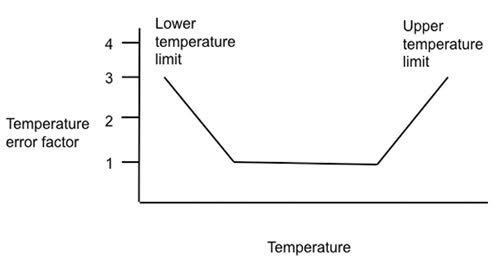
    Fig 10. Sensor temperature error factors


    Conclusion

    Accurate pressure measurements are crucial across various industries and applications, and pressure sensor accuracy is influenced by multiple factors. Understanding the intricacies of pressure sensor accuracy involves considering calibration, environmental conditions, mechanical stress, and non-linear behaviors like hysteresis and non-linearity. Each of these factors can impact the sensor's ability to provide precise and reliable readings.

    Different methods, such as comparison with reference standards, endpoint measurements, or linearity assessments, offer ways to evaluate and quantify a sensor's accuracy. However, no single method can fully capture all aspects of accuracy. Combining multiple evaluation techniques provides a more comprehensive understanding of a pressure sensor's performance.

    Manufacturers strive to minimize these factors' effects by employing precise manufacturing processes, incorporating compensation mechanisms, and providing calibration procedures. Regular recalibration and maintenance are crucial for sustaining accurate readings over time.

    Ultimately, selecting the right pressure sensor for a specific application requires considering accuracy specifications, understanding how those specifications apply across different pressure ranges, and aligning them with the application's requirements.

    By acknowledging and addressing these factors affecting accuracy, users can make informed decisions, ensuring that pressure sensors deliver the needed precision and reliability for their intended purposes.

    To recap

    1.What does accuracy mean for a sensor? Accuracy refers to how closely a sensor's measurements match the actual value being measured

    2.How is accuracy typically expressed for sensors? Accuracy is often expressed as a percentage of full-scale output (%FSO) or in absolute units (e.g., psi, bar) representing the maximum permissible deviation from the true value.

    3.What factors affect a sensor's accuracy? Factors include calibration, environmental conditions, hysteresis, linearity, mechanical stress, manufacturing variations, electronic noise, aging, and wear.

    4.What is hysteresis about accuracy? Hysteresis is the phenomenon where a sensor's output differs for the same value depending on whether the input is increasing or decreasing. It can affect accuracy by introducing non-linear behavior. 

    5.How do you evaluate a sensor's accuracy? Evaluation involves various methods such as comparison with reference standards, endpoint measurements, linearity assessments, and analyzing hysteresis and repeatability.

    6.What is the difference between accuracy and precision? Accuracy refers to how close a measurement is to the true value, while precision relates to the repeatability and consistency of measurements. 

    7.Why is calibration important for maintaining accuracy? Calibration ensures that a sensor's readings align with the true value. Over time, sensors may drift, and calibration helps bring them back to an accurate state.

    8.How do environmental conditions impact sensor accuracy? Temperature, humidity, altitude variations, and other environmental factors can influence a sensor's performance and accuracy.

    9.Can a sensor have different accuracy specifications at different pressure ranges? Yes, sensors might have varied accuracy specifications across different pressure ranges within their operating limits.

    10.Why is understanding a sensor's accuracy crucial for selecting the right sensor? Understanding accuracy specifications helps in choosing a sensor that meets the precision requirements of the specific application, ensuring reliable measurements.

    These FAQs provide a foundational understanding of accuracy and error specifications for sensors, assisting users in making informed decisions when selecting and utilizing sensors for diverse applications.

    References

    https://dwyer-inst.com/en/list/post/understanding-pressure-sensor-accuracy

    https://blog.wika.us/knowhow/pressure-transmitter-accuracy-and-non-linearity/?doing_wp_cron=1704830448.0383119583129882812500

    https://www.solinst.com/onthelevel-news/water-level-monitoring/water-level-datalogging/understanding-pressure-sensor-accuracy-precision-resolution-drift/

    https://www.designworldonline.com" rel="nofollow"/understanding-accuracy-and-precision-for-mems-pressure-sensors/

    https://www.google.com" rel="nofollow"/url?sa=i&url=https%3A%2F%2Fwww.evidentlyai.com%2Fclassification-metrics%2Faccuracy-precision-recall&psig=AOvVaw0H54M8sxTJ_atKKNajL_s1&ust=1704917635366000&source=images&cd=vfe&opi=89978449&ved=0CBMQjhxqFwoTCIjtx76Q0YMDFQAAAAAdAAAAABAI

    https://www.setra.com" rel="nofollow"/blog/accuracy-end-point-vs-best-fit-straight-line-method/

    https://www.eastsensor.com" rel="nofollow"/blog/pressure-sensor-repeatability/

    16th Jan 2024

    Recent Posts